In Volume 6 of my weekly roundup I highlighted some newly released data from the city of Toronto about Highrisers Building Inspection data. The newspaper that reported about it was not happy about the format that it was available. And I agree it is not very searchable or does not provide too much information.
But: They use an API to show the data in the table. And it turns out, I can use the API as well. It took some time to find out what type of API and database was involved to query the data. After a few hours of searching and trying out I succeeded.
The next step was to do some exploratory data analysis.
The question
The question that I asked the dataset was:
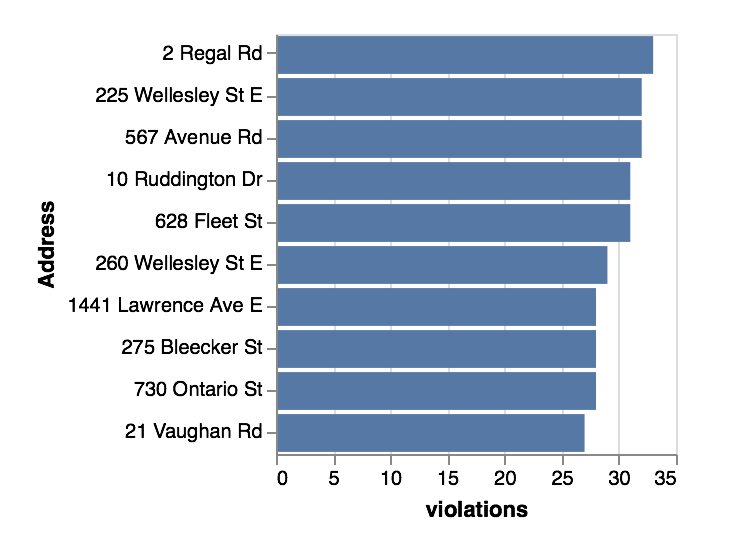
Which buildings have the highest amount of violations the public should know about.
If you life in 2 Regal Rd you might want to contact your landlord
As of this writing the most violations occurred on 2 Regal Rd. After looking at the table these 30 violations occurred on 2 inspections. They all got resolved but this might be a sign to inspect more often.
https://www.google.de/maps/place/2+Regal+Rd,+Toronto,+ON+M6H+2J4,+Kanada/@43.6756197,-79.4333534,17z/data=!4m2!3m1!1s0x882b347baec4f25f:0x5e576b821b01c4ea
Here are the top 5 buildings with the most violations:
The overall picture
The data is from Janaury 2017 until today. In total there were ~12000 violations in that time period. That is about 500 per month and x per inspection. Nice job to inspect the right houses.
The most reported violation type is: 2.2.3.2 Maintenance of closures.
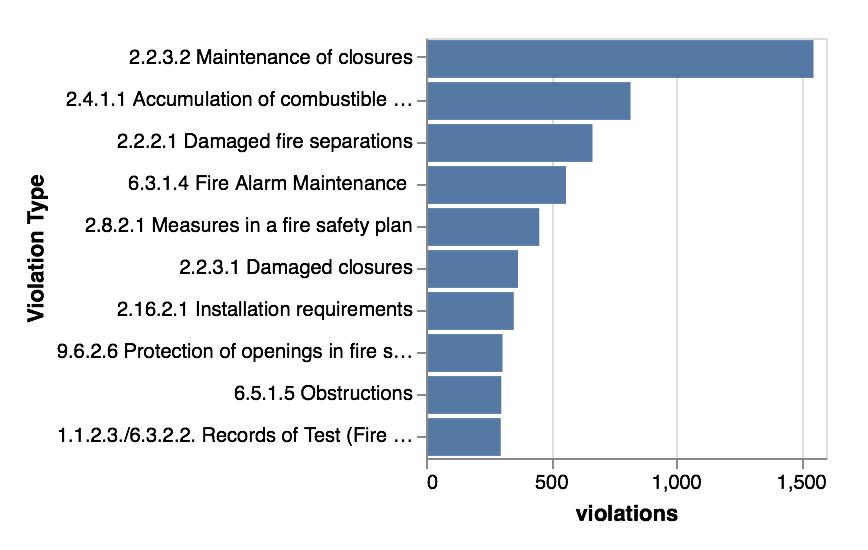
2.2.3.2. (1) Closures in fire separations shall be maintained to ensure that they are operable at all times by (a) keeping fusible links and heat or smoke-actuated devices undamaged and free of paint and dirt, (b) keeping guides, bearings and stay rolls clean and lubricated, © making necessary adjustments and repairs to door hardware and accessories to ensure proper closing and latching, and (d) repairing or replacing inoperative parts of hold-open devices and automatic releasing devices.
(https://www.ontario.ca/laws/regulation/070213
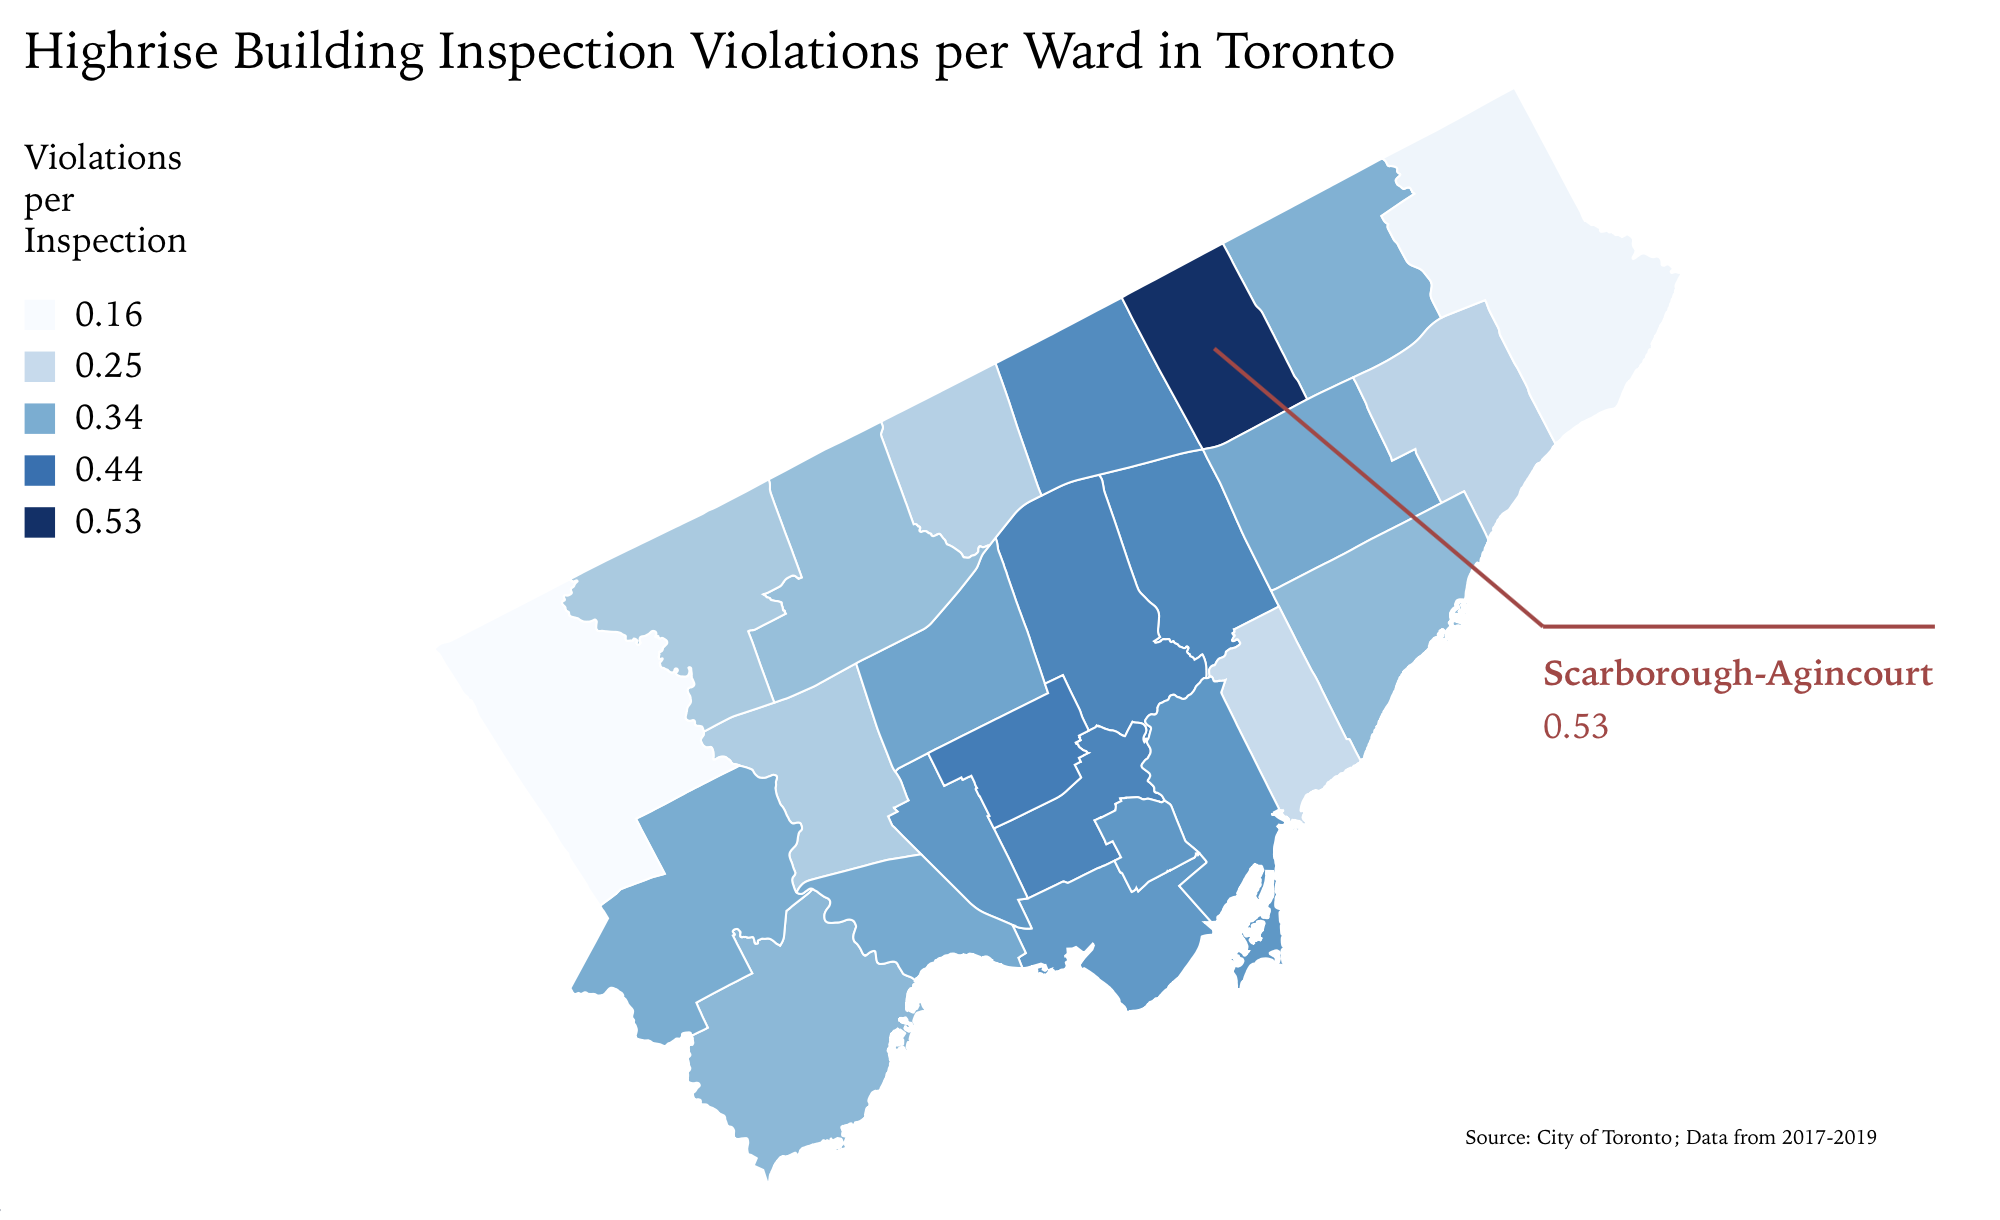
Which Ward has the most violations?
This was the next question I asked the data. I love maps and a nice overview of where the most violations occur. One thing that is missing from the data that would have made the map even more useful would be the amount of HighRise Buildings per ward. But we don‘t have that information.
I created an Observable Notebook for everyone to try it out. I reached out to the initial source of this information. When they get back to me I will update this post.
Do you have a similar problem. You find some data but are not able to really dive into the data because it is in a strange format or from a strange source. Reach out to me. I can help you.