This Week was a slow week for visualizations, but we have a lot of tweets of what folks talked about in Civic Tech. And the Shifting Neighborhoods story makes up for it, because it is so great.
Visualizations
SHIFTING NEIGHBORHOODS
Gentrification and cultural displacement in American cities
This report is sad but very well made. It looks at census tracts and their development over time and calculates if they are gentrified and if there is a social displacement happening as well.
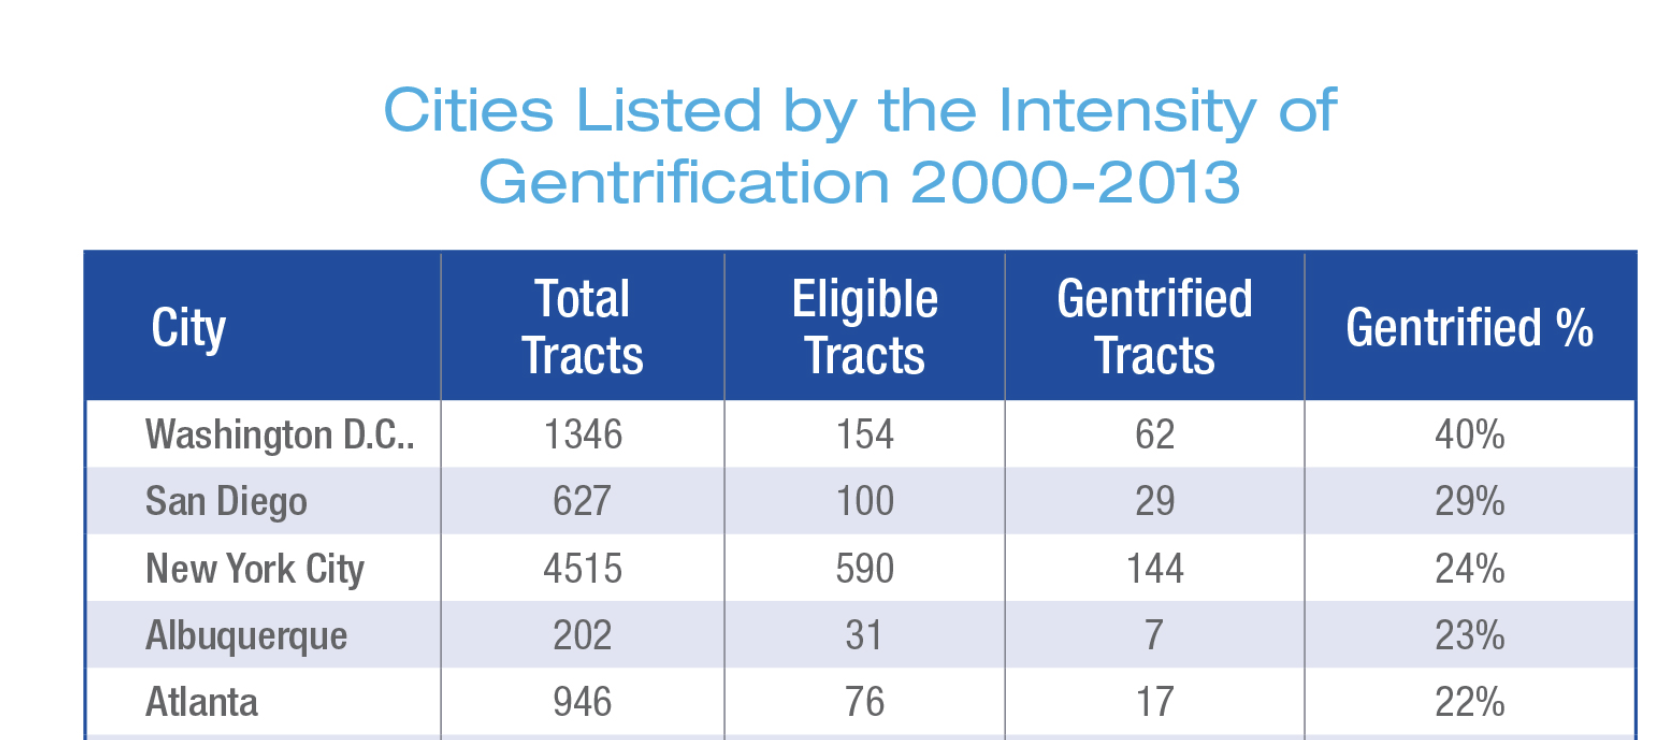
There are a ton of graphics in this report that helps make the point.
Let’s dive a little deeper, but I think this should be a separate post.
The next graphic is a little misleading or does not make an excellent point. Bigger cities tend to have more neighborhoods gentrified because they have more census tracts. They have identified 1000 census tracts to be gentrified. If a census tract has on average a population of 4000 (source), this means that 4,000,000 people or ~1% of the US population are facing or faced gentrification.
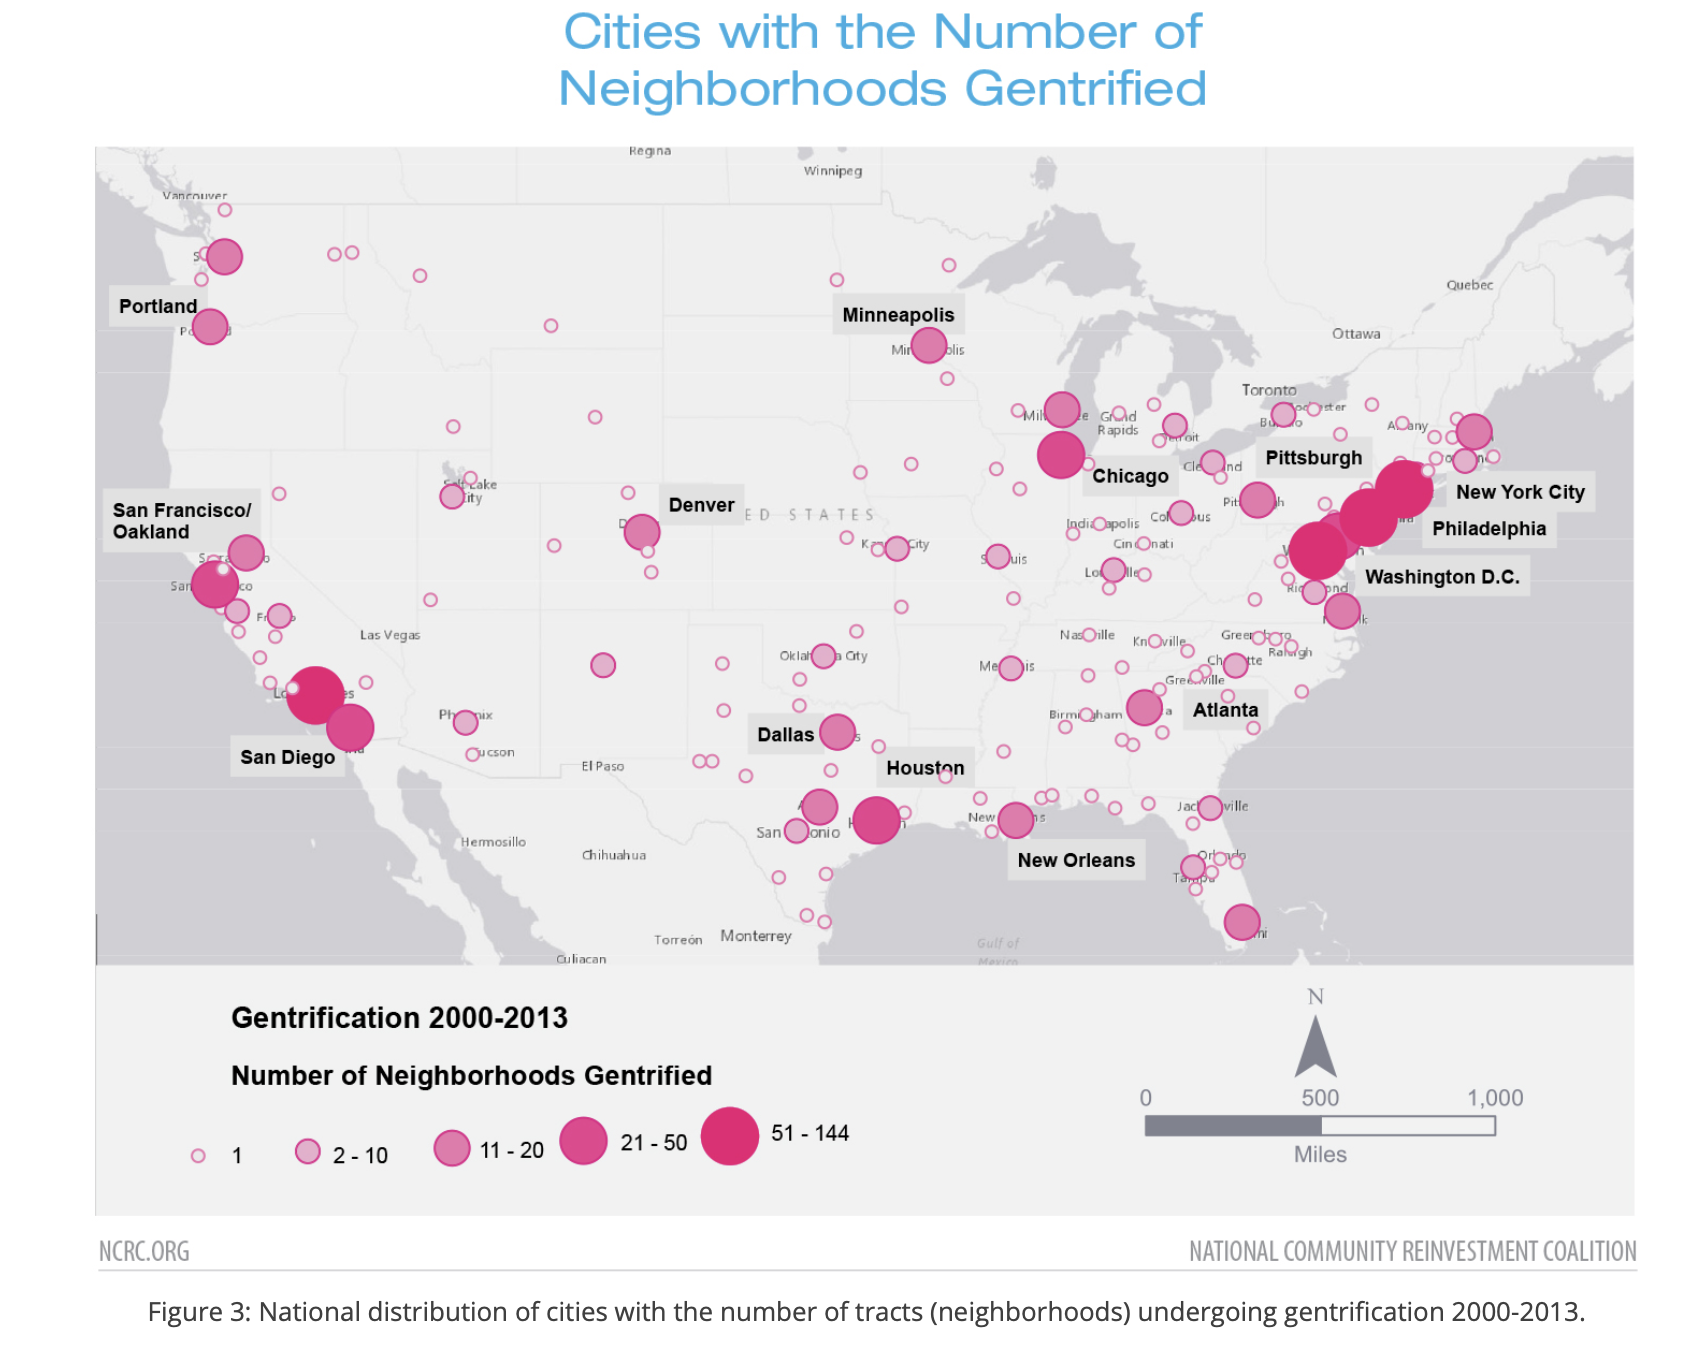
They have a graph later that would be much better suited for this map: “Cities with high percentages of eligible gentrifying neighborhoods.” And it paints a more nuanced picture.
They also include an interactive version of their map but “only” for the tracts, not the bubble maps.
Takeaway:
Be aware of population maps. Mapping an absolute number only makes sense in very limited cases.
AirBnB Data
New airbnb dashboard built on our open data network, showing valuable insights for cities real estate. How are prices evolving? The number of rooms available? Easily analyze over a million records worldwide
It’s excellent that AirBnB finally shares some more detailed data and I encourage everyone to check this out. There are a lot of cities available. But there is no legend for the colors. You need to click individual neighborhoods to see the underlying data.
Takeaway:
Always include your legend. Make it easier for your users to understand your map.
Civic Tech
Boston Birth Certificate App
Need a Boston birth certificate? You can now order one online.
Great writeup about the way the City of Boston built the Birth Certificate app.
At the beginning of this project, we invested time researching the reasons why people get birth certificates. The goal was to understand who the audience for the application was, and to ensure our design met their needs.
City of Louisville Builds Open Source Traffic Tools using Data, Collaboration, and the Cloud
Using AWS, Schnuerle, and his team have created an open-source, cloud-based system for historic and real-time querying, analysis, API hooks, mapping, and integrations. Instead of paying $50,000 for a multi-week traffic study to see if your road configuration changes had an impact, you can use this Waze cloud database at no cost for instant, unlimited results.
Civic Tech Reads of the Week
We’ve got quite the selection this week, ranging from the French gilets jaunes to the nature of online identities. Missed your last weekly dose of mind-boggling reads?
New dataset: Detailed Manifest - All Incoming Containers at Port of Savannnah, 2018
1.3 million records of all incoming bills of lading arriving at Port of Savannah during 2018.
New App: Adapt a Drain Durham
Articles
Civic Tech/Community
Open Government/Open Data
Tweets
Tech Voice Chicago is about heroic stories of civic volunteers creating community in technology. The first annual print edition arrives October 2019 #civictech #socialgood #chicago #technews #technology #diversityintech #chicagotech pic.twitter.com/3Aw0DLoXF7
— TechVoiceChicago (@TechVoiceChi) March 23, 2019
@DurhamStormH20 @CityofDurhamNC Help your community by adopting a drain during Creek Week at https://t.co/Anw1fifHKc . It's free and only takes a few minutes! #stormwater #durham
— Code for Durham (@codefordurham) March 20, 2019
The Office on Women’s Health (OWH) is seeking new ways to get health messages out to women and girls. $200,000 in prizes! https://t.co/gR8j0C7RZD
— Code for Atlanta (@codeforatlanta) March 20, 2019
From transparence to inclusivity and debate depolarisation, here are our 7 key takeaways from the #TICTeC 2019 conference! https://t.co/QRbEExgXFi 🗒️ cc @mySociety #civictech #digitaldemocracy
— CitizenLab (@citizenlabco) March 22, 2019
Thanks to Fellow @NevinTaylor for his impactful work at the @StateDept. You too can join the #CivicTechService. We are growing and actively recruiting for our summer cohort----> https://t.co/3HtJnSj2bZ #CivicTech pic.twitter.com/CMiHa88DBb
— PIF (@InnovFellows) March 22, 2019
This week @luminategroup announced a shift in their approach to #CivicTech funding, with increased focus on nontechnical advocacy. It may seem obvious, but it took civic tech groups a long time to learn that "technology is not the panacea for engagement". https://t.co/fUYRMQSFza
— Soren Spicknall (@SorenSpicknall) March 22, 2019
"The goal of Government as a Platform must be able to enable radically better services for the public."@richardjpope starts off a series on the emergence and implications of digital platforms in government. https://t.co/T8n28nwj8X
— Code for Canada 🇨🇦 (@code4ca) March 22, 2019
"The project intentionally does not look at path-dependencies of today’s governmental institutions. On the contrary, it opens up the imagination by exploring new future forms of government that are driven by the needs of diverse stakeholders." https://t.co/GAQ7NGEpOH @g0vtw
— code-for-PDX (@codeForPDX) March 22, 2019
"How will citizens, together with other actors, shape governments, policies and democracy in 2030 and beyond?" https://t.co/GAQ7NGEpOH @PDXCityClub @comm_civic_life
— code-for-PDX (@codeForPDX) March 22, 2019
Excited about @GavinNewsom 's proposed Office of Digital Innovation? So are we! https://t.co/8tFQ1cevWe … @StuartDrown @Pete4CA @patwater @ninakin9 @JeanneHolm @pahlkadot @LuzRivas @laurafriedman43 @CityGrows
— Catherine Geanuracos (@geanuracos) March 22, 2019
Connect with those who make water work this #WorldWaterDay, creating Smart Sewers, enabling Digital Engagement, Bridging Siloes to support global collaboration on our world's water challenges: https://t.co/UX0K6wzXCP #WaterTech #CivicTech
— Mary Conley Eggert (@MaryEggert) March 22, 2019